Iain Fulton Investment Director Edinburgh
04 Mar 2022
History rhymes
Have you ever stopped to imagine what would happen if the world’s central banks spent just over a decade pouring USD 25 trillion of liquidity into the economy with more than 60% of that liquidity created in the last two years? If you are like the overwhelming majority of people, the answer is almost certainly no. The good news is you don’t have to imagine as this is exactly the situation we are in today! Take a step back, look around and see the results for yourself! In this article, we’ll try to assess what has happened and think about how investors should navigate the next phase of the greatest financial experiment of all time.
USD 25 trillion is almost an unimaginable amount of money so what has happened to all of this liquidity? Well, rather inevitably, a lot of it has found its way into asset markets. The value of almost everything has gone up – considerably. From wine to whisky, growth stocks to digital gold, the returns to asset owners have been extraordinary since the depths of the financial crisis in 2009. Younger generations have gone from occupying Wall Street to trading Bitcoin on margin and buying meme stocks on trading platforms as if it were a video game. Old people “just don’t get it” and lack the imagination to see just how enormous the returns will be.
Make no mistake, there are many aspects of this that have the trappings of a bubble. This is nothing new. In late 1636 in the Netherlands, the Viceroy tulip bulb sold for four fat oxen, eight pigs or 12 fat sheep. As many bulbs flowered in 1637, prices crashed and by early 1638, the government decreed that tulip contracts should be annulled in return for the payment of 3.5% of the original price.
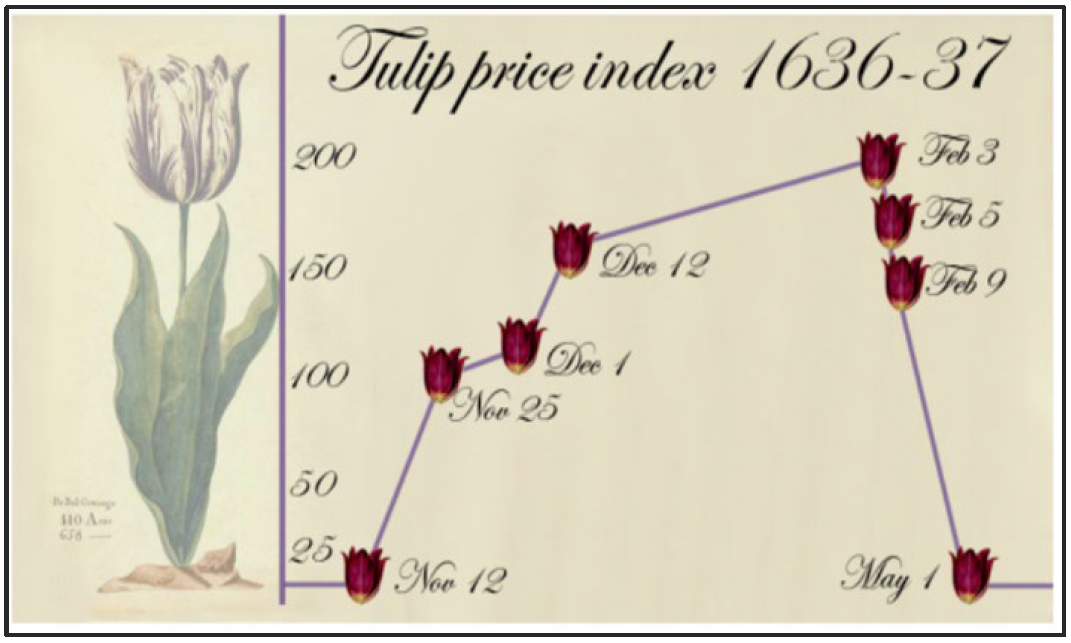 Source: Charles Mackay. Extraordinary Popular Delusions and the Madness of Crowds, 1841.
There are many other examples of financial speculation littered throughout history and interestingly several of these are also linked to technological innovation. Investors in railway bonds in the 19th century enabled the construction of vast networks in Europe and the US which enhanced productivity and had a huge impact on the way people lived and worked. Investors in railroads typically made little profit however, and most of the long-term gains were arguably made by the businesses and people in cities which grew up as a result of their newly connected status.
The dot-com internet bubble of the late 1990s had a very similar story at its heart. Investors in the companies who built the internet networks and operated them thereafter either lost everything or made very poor long-term returns. The real beneficiaries of the networks created in the bubble were businesses like Apple, Google, Facebook, Netflix and Amazon*, who used those networks to sell us the products and services that meant we got the most out of them. They were effectively the hotel at the end of the railway line which stood to gain most from the passengers arriving on the newly constructed network.
Is there a bubble today and if so, where is it and how will things pan out from here? The first thing that strikes us is investors’ very long-time horizons and the sheer number of companies who are forecast to make significant losses for the foreseeable future. This is dangerous. The future is highly unpredictable, and far more things can happen than actually will happen. For example, if you were asked in 1969 what would be the greatest innovation in 40 years’ time, you’d be forgiven for answering that humans would have colonised space and we would all be going on holiday to Mars (given Neil Armstrong had just set foot on the moon). Instead, the reality in 2009 was that the Apple iPhone was being rolled out which effectively placed the sum of all human knowledge in your pocket! We should be wary of people selling us a version of the future based on science fiction rather than practical and applicable fact.
This unpredictability makes today’s stock market dangerous indeed. If a company is asking you to think 20 to 30 years out to generate an investment case, be careful! Especially if this business is forecast to make losses and burn cash flow for the foreseeable future. The dramatic unwind we are seeing in markets is the first phase of these time horizons shortening as central banks withdraw the liquidity which has fuelled such excess. US electric vehicle company Nikola achieved a USD 35 billion market capitalisation with zero revenue!
Given the dangerous nature of speculative businesses with heavy losses which are burning cash, what should we do from here? For us, understanding the drivers of cash flows and the returns on investment being made by the companies we invest in is critical to the long-term health of our portfolio. By investing in businesses with strong competitive advantages who remain disciplined around their capital allocation, we aim to find the next set of hotels at the end of the railway line who will benefit from the new activities created by this latest bout of speculative excess.
If lesson one is to avoid loss making, cash burning businesses chasing a pipe dream of market share and focus on profitable companies with sustainable competitive advantage, what else should investors beware of? In our opinion, lesson two is “beware the wolf of cyclicality wrapped up in the sheep’s clothing of growth”. The journey from growth stock to value stock can be seriously damaging to your financial health. It strikes us that in industries such as digital advertising, investors may be mistaking a maturing industry which has seen a pull forward of demand for one which still offers enormous secular growth. As discussed, the pandemic saw an enormous amount of liquidity added to the system and many speculative businesses received funding and/or very high valuations which they may not have otherwise. It’s worth noting that a good amount of these new companies’ costs (after generous option packages for senior staff of course) are spent on IT infrastructure and services as well as digital advertising to gain market share. When you add in the pull forward of time spent at home/online for consumers in the pandemic, it is perhaps no surprise that digital advertising in all its forms may face a more challenging outlook over the next few years. (Not to mention the inflationary pressures many businesses face which will put pressure on discretionary advertising budgets).
*Reference to individual stocks is for illustration purpose only and does not guarantee their continued inclusion in the strategy’s portfolio, nor constitute a recommendation to buy or sell.
Navigating choppy waters
If we have established a few things to avoid, the obvious question remains around where are the opportunities? In our opinion, there are many businesses which have been left behind from the speculative excess of the last two years because their businesses have been negatively impacted by the pandemic in the short term. In the provision of home nursing care and patient rehabilitation, companies such as LHC group and Encompass Health have suffered from a dramatic rise in costs due to a shortage of nurses exacerbated by the need for staff to quarantine following exposure or even potential exposure to COVID-19. As the pandemic ebbs, the staffing situation is expected to normalise, and we see the companies benefitting from improving pricing as the Centers for Medicare and Medicaid Services (CMS), a US federal agency that administers the Medicare programme, has passed reimbursement rates which begin to take account of these near term challenges. This should position these companies for a better 2022 while many in the digital advertising industry may face exactly the opposite scenario.
A second area we feel remains underappreciated is in the provision of contract catering. Punished by the stringent lock downs and a shift away from working in office locations, these businesses were forced to raise capital and adapt quickly to a very new reality in the pandemic. As it turns out, as healthcare providers, schools and universities grapple with rising costs and labour shortages, it has meant that they are now outsourcing their catering operations at a record pace and the pipeline of new business for a company like Compass has never been better. Also, consumption at stadiums where the firm has many concessions is booming as people make the most of attending live sports and cultural events which have been off the menu for two years. These businesses are reinvesting for structural growth, but many investors perceive them to be too old hat to be interesting. Boring old improvements in return on capital might be just the menu item investors should choose in what may continue to be a challenging 2022.
Valuation rationality and margin for safety
We have highlighted already in this article that we have been experiencing some speculative excesses within parts of the equity markets for some time and there have some clear parallels to historical bubbles. Our philosophy is focussed on compounding clients’ capital over time rather than being slave to the shorter-term gyrations of the market and as such we have always been focused on the following:
- Invest only in companies that can grow and attain and sustain high returns on invested capital are the best source of long-term superior returns. The path of sustaining, or even better improving, returns in capital tends to be dictated most by an individual company’s unique franchise and its management team. In most cases therefore the Future Quality investment case is not dependent on shorter term economic cycles.
- Valuation is one of our key pillars, as the pricing of future growth can sometimes swing notably towards high pessimism or optimism and therefore justify either larger weightings or the exit of a position in favour of better ideas.
The latter point has been more relevant for portfolios in the last 12-18 months, as we have been in a period where very easy monetary policy has encouraged investors to price future growth very generously. This has resulted in reductions in some holdings or a complete exit on valuation grounds, with the proceeds being recycled into Future Quality companies that have much better valuation support. We are comfortable paying a premium for companies that deliver better and more consistent growth, can attain and sustain high returns on invested capital and have strong balance sheets—but that premium needs to be appropriate and fair. The following history from style analytics shows that we have indeed stuck to that discipline.
Chart 1: Cash Flow Yield
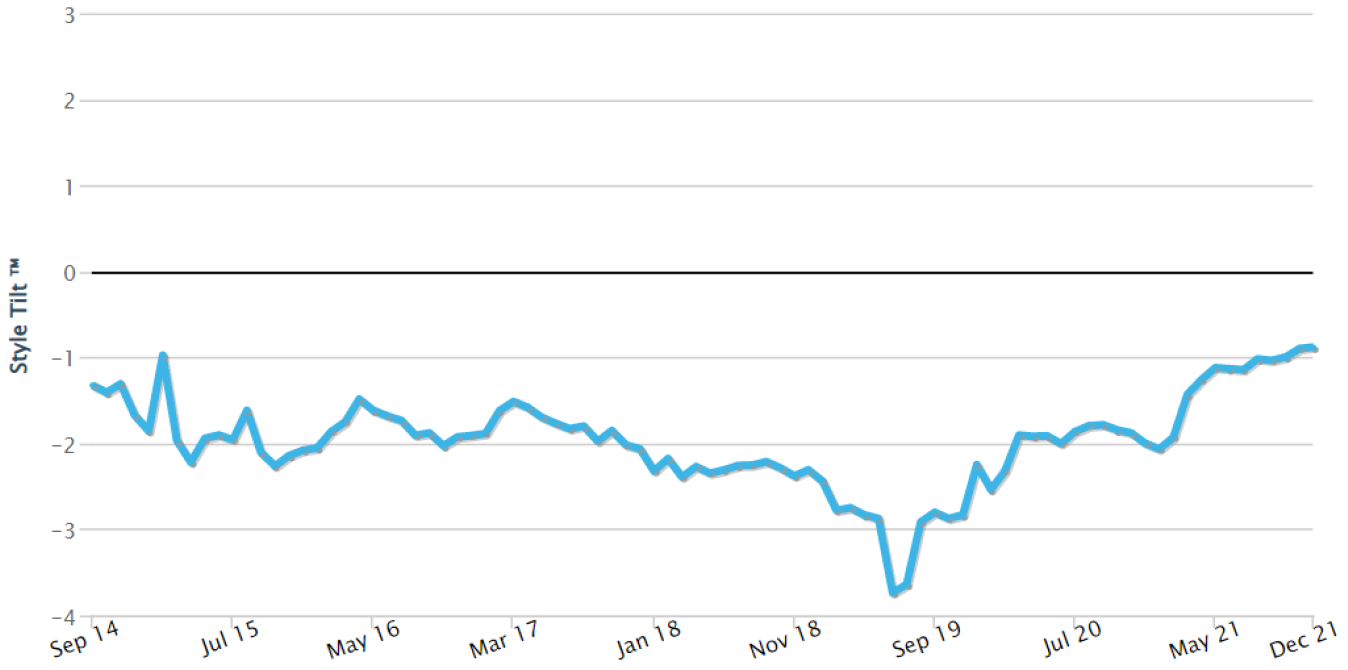
Source: Style analytics as at 31 December 2021. Reference to individual stocks is for illustration purpose only and does not guarantee their continued inclusion in the strategy’s portfolio, nor constitute a recommendation to buy or sell.
Looking forward our best guess is that we have entered into an unknown period of tightening liquidity, with the evolution of supply related inflationary inputs and central bank responses remaining the dominant drivers for returns from and within equities as an asset class. History would suggest that after an unwind from periods of excess the prior winners typically don’t retain leadership again. Given the lack of profitability of many companies in the cohort that some have described as concept finance, this makes sense as over the long term the delivery of cashflow and growth is the key determinant on share prices.
Chart 2 highlights that the growth versus value debate that is dominating many conversations is becoming less important for most companies other than those with very high growth expectations. The path of future growth and profitability will likely soon start to dominate again as the key driver for individual share prices once the current period of unwind and rotation has exhausted. We believe our portfolio of Future Quality stock picks should be well placed when that day arrives.
Chart 2: Group Median Market Implied Yield (MIY) Spread vs Market
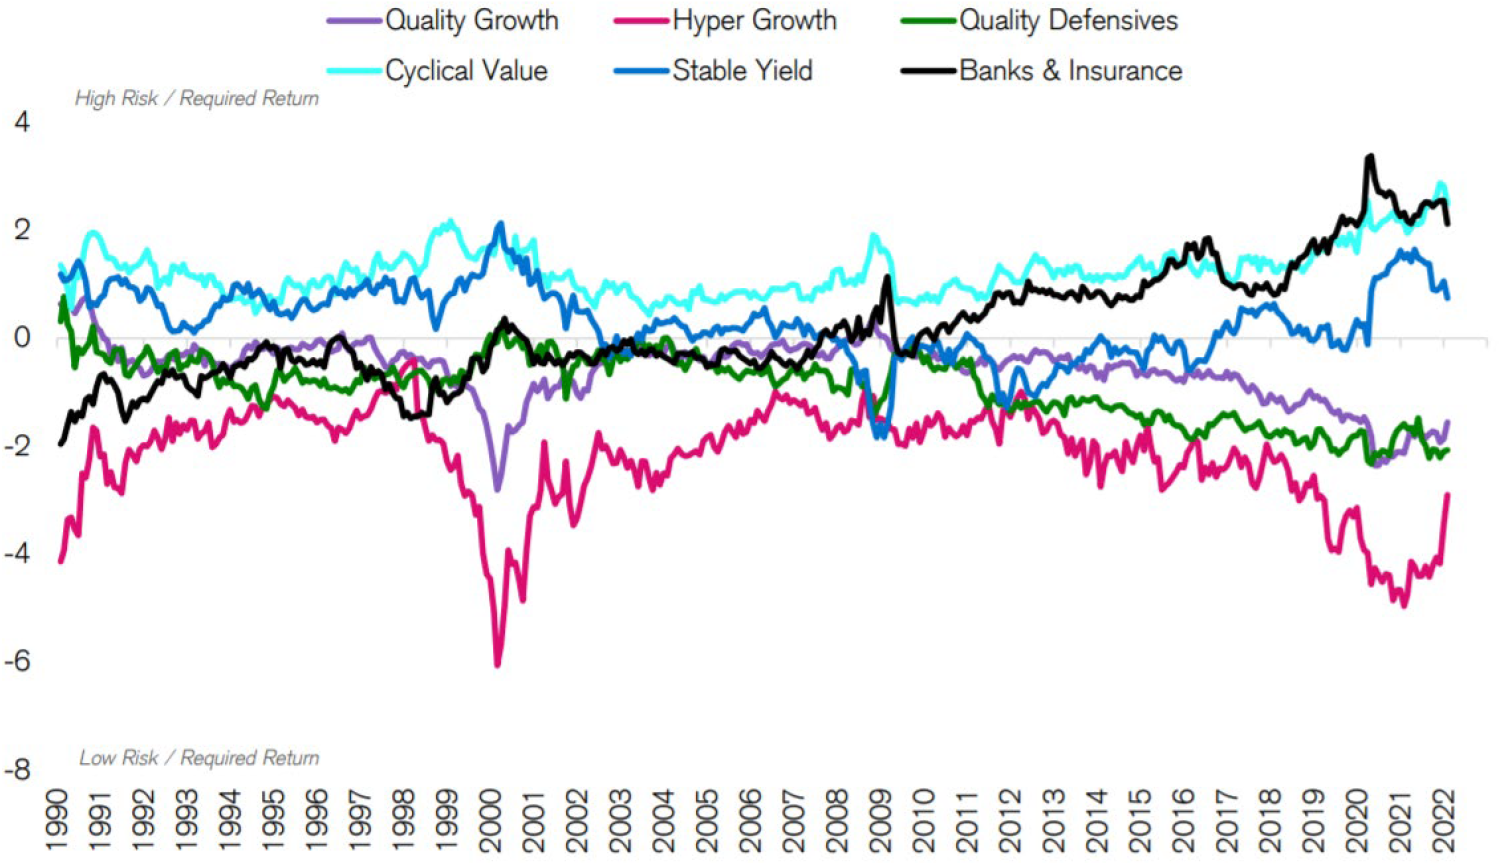
Source: Credit Suisse HOLT, Data date 2/4/2022. Universe: Top 2000 Global companies by TTM Market cap. Market Implied Yields for Financial firms on the HOLT CFROE model are trimmed by 150 bps throughout this analysis to preserve comparability.
Strong ESG credentials
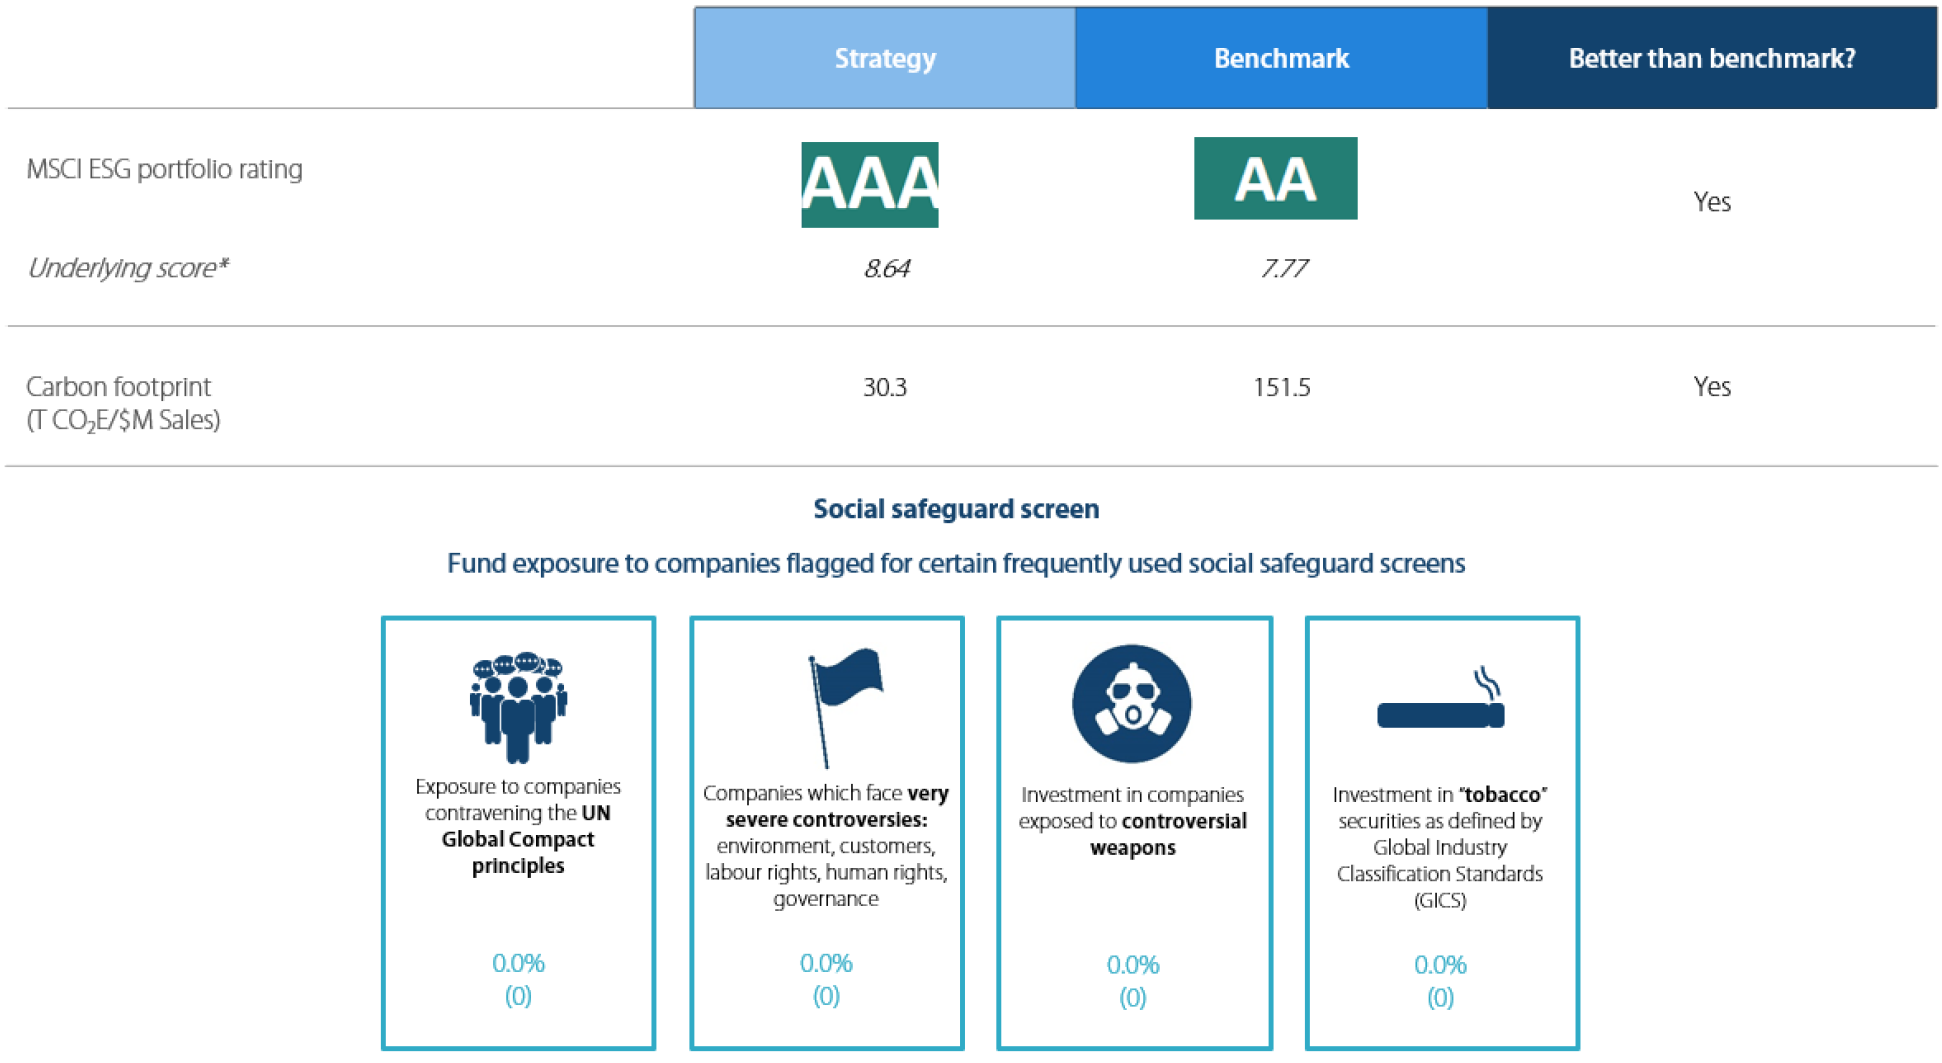
* Underlying score is the MSCI ESG Quality Score, Carbon Footprint is Weighted Average Carbon Intensity Data supplied as per the MSCI definitions. Fund is a representative account of the Nikko AM Global Equity Strategy. Benchmark is the MSCI ACWI.
Global Equity Strategy Composite Performance to December 2021
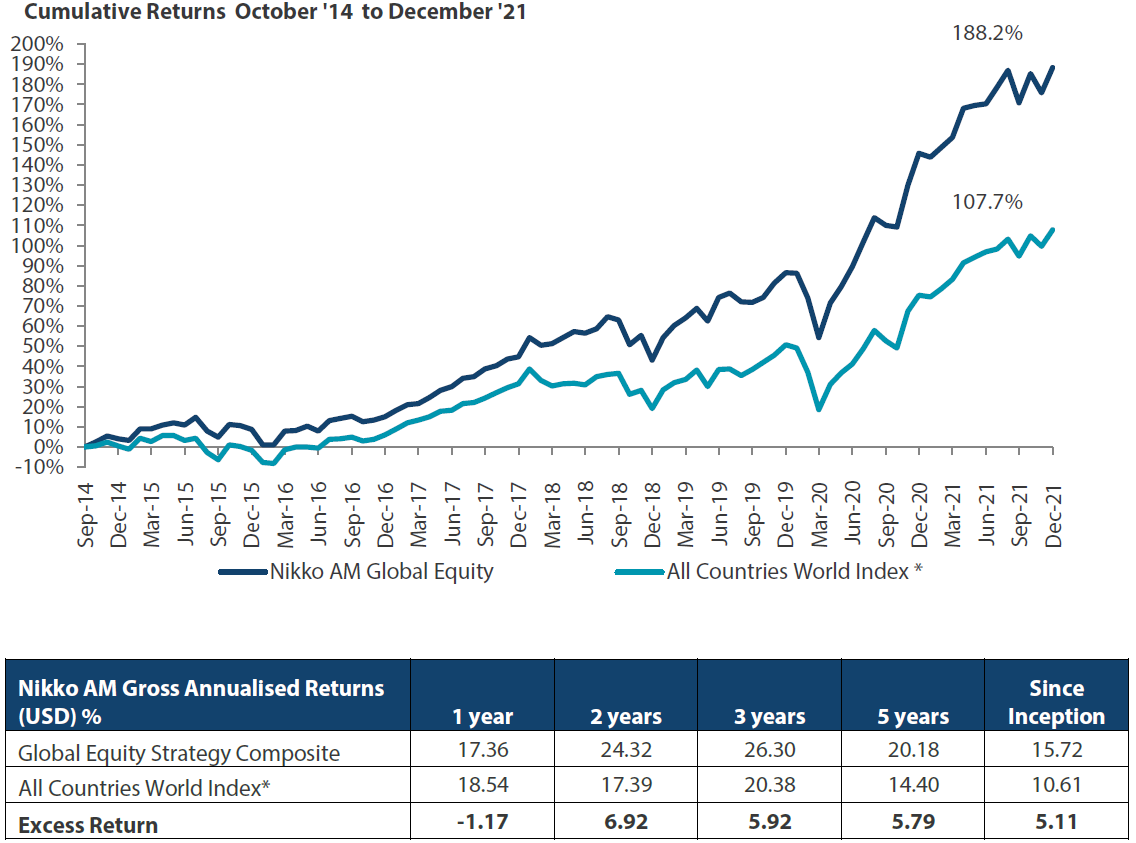
*The benchmark for this composite is MSCI All Countries World Index. The benchmark was the MSCI All Countries World Index ex AU since inception of the composite to 31 March 2016. Inception date for the composite is 01 October 2014. Returns are based on Nikko AM’s (hereafter referred to as the “Firm”) Global Equity Strategy Composite returns. Returns for periods in excess of 1 year are annualised. The Firm claims compliance with the Global Investment Performance Standards (GIPS ®) and has prepared and presented this report in compliance with the GIPS. GIPS® is a registered trademark of CFA Institute. CFA Institute does not endorse or promote this organization, nor does it warrant the accuracy or quality of the content contained herein. Returns are US Dollar based and are calculated gross of advisory and management fees, custodial fees and withholding taxes, but are net of transaction costs and include reinvestment of dividends and interest. Copyright © MSCI Inc. The copyright and intellectual rights to the index displayed above are the sole property of the index provider. Any comparison to reference index or benchmark may have material inherent limitations and therefore should not be relied upon. For more details on the Firm’s compliance with GIPS, please contact GIPS_inquiry@nikkoam.com. Data as of 31 December 2021.
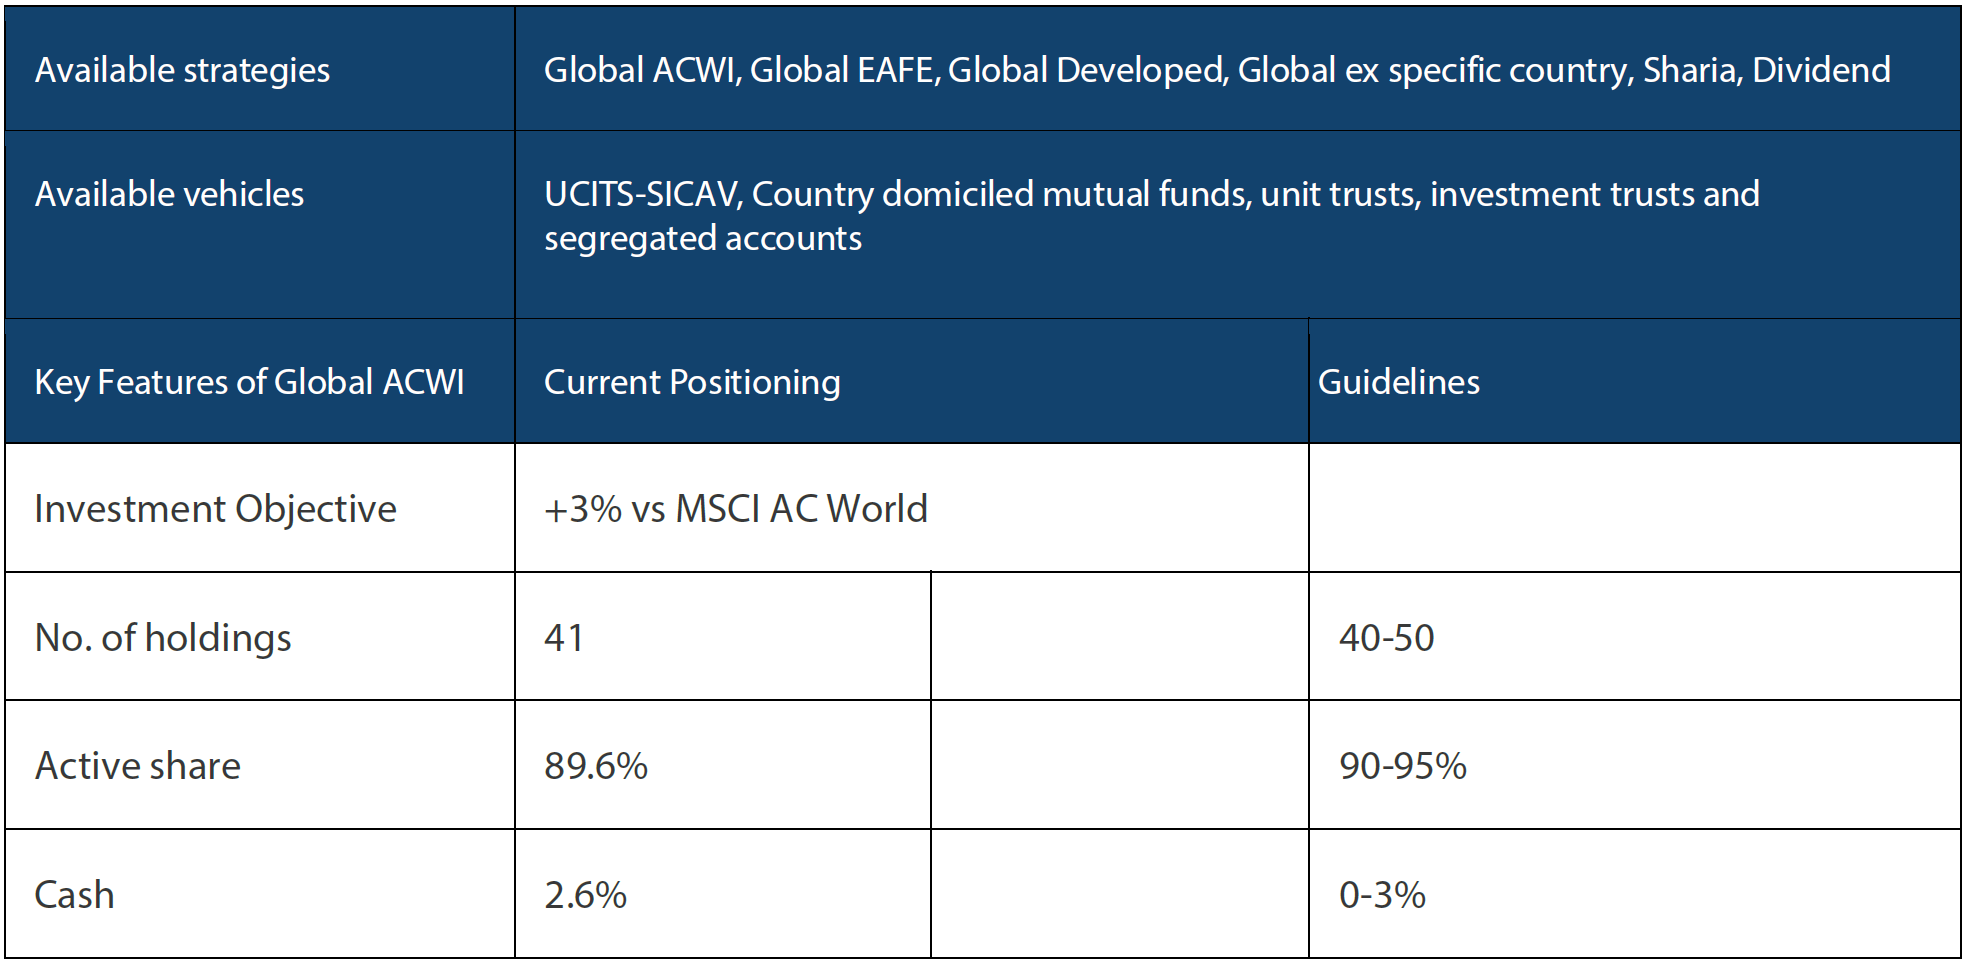
Nikko AM Global Equity: Capability profile and available funds (as of December 2021)
Target return is an expected level of return based on certain assumptions and/or simulations taking into account the strategy’s risk components. There can be no assurance that any stated investment objective, including target return, will be achieved and therefore should not be relied upon.
Past performance is not indicative of future performance. This is provided as supplementary information to the performance reports prepared and presented in compliance with the Global Investment Performance Standards (GIPS®). GIPS® is a registered trademark of CFA Institute. Nikko AM Representative Global Equity account. Source: Nikko AM, FactSet.
